
What is Avalanche
Granular Materials and Criticality
Granular materials lie somewhere between liquids and solids: while a pile of sand at rest looks solid, when you pour extra sand on it from above, you can either obtain a continuous, liquid-like flow of sand on the surface of the pile, or you can get intermittent flow - sometimes called avalanche dynamics. As the flow of sand itself, very often researchers in the field tend to be segregated into two groups: some of them study the statistics of avalanches, while others study the mechanisms of individual avalanches.
Granular Materials and Criticality
Self-organized Criticality
Self-organized criticality (SOC) refers to the tendency of dissipative systems to drive them into a critical state, which will undergo avalanches starting from fluctuations. An avalanche is the expression of the separation of time scales of the drive inducing the avalanche and its relaxation time at which it stops. It is described by its size (mass), duration, area covered, and radius of gyration. The distribution of the avalanche either in space or in time usually obeys finite scaling as well as long-range spatiotemporal correlations. Hence, the frequency of the avalanche can be described with 1/f noise (pink noise) independent of the initial conditions and without fine-tuning of the parameters. It has the form S(f) proportional to 1/fα, where f is frequency bounded away from both zero and infinity. A power-law distribution displays a scale-invariance that is also a feature of continuous second-order phase transitions. It is represented as a straight line on a log–log plot. Such stochastic processes with long-term correlations and 1/fα (0.5≲α ≲ 1.5) behavior of power spectra at low frequencies are observed in nature including in physics, biology, geophysics, economics, and psychology. If avalanches originated from almost independent toppling sites, their distribution would be Gaussian-like. The fact that they exhibit a nontrivial power-law distribution hints that there are spatiotemporal correlations and not only either spatial or time correlation. In the critical configuration, small fluctuations cause events of all sizes s with probability density p(s) with a power function p(s) = ks−τ. SOC dynamical systems produce 1/f noise as the lifetime t is related to the size of the event s, by t1+γ ≈ s where γ is the rate at which the event propagates across the system.
Vortex Dynamic Model
Dynamic Model
 Magnetization of Hard Superconductors
C.P. Bean, Phys. Rev. Lett. 8, 250 (1962)
 critical current density <-> critical slope in B
Vortex matter ~ Granular medium
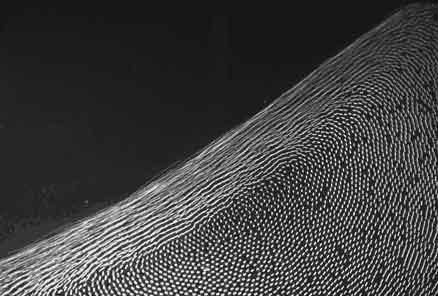
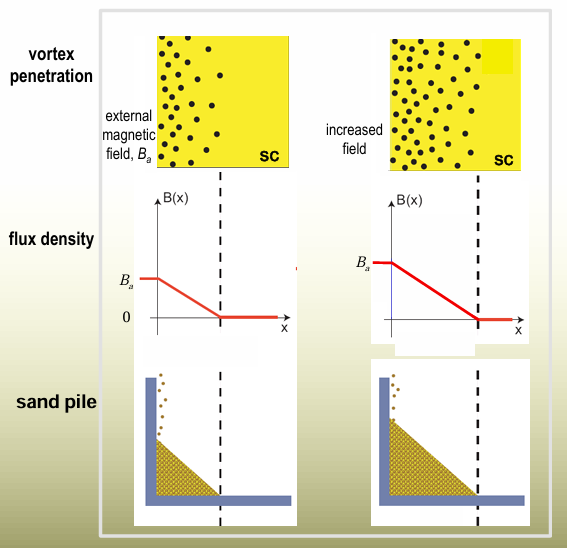 “We can get some physical feeling of this critical state by thinking of a sand hill” book on Superconductivity (1966) P. G. DeGennes:
Thermomagnetic Instability
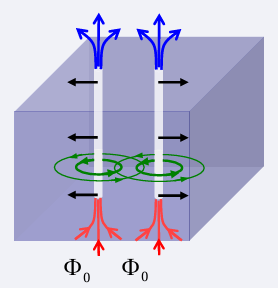
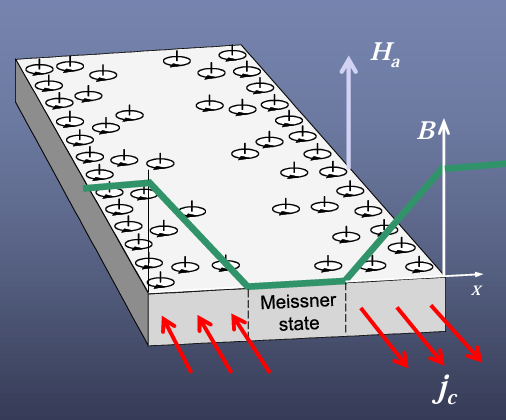
From the critical state model above we know that if a magnetic
the field is applied slowly to a type II superconductor, new vortices will be pro
reduced at the edges of the specimen. The Lorentz force will move them toward the center, while the pinning force in structural irregularities will try to hold them back, forming a flux density gradient with a maximum at the edge of the superconductor and a minimum (no vortices) at a certain distance from
the edge
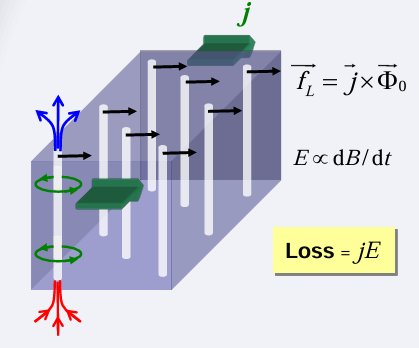
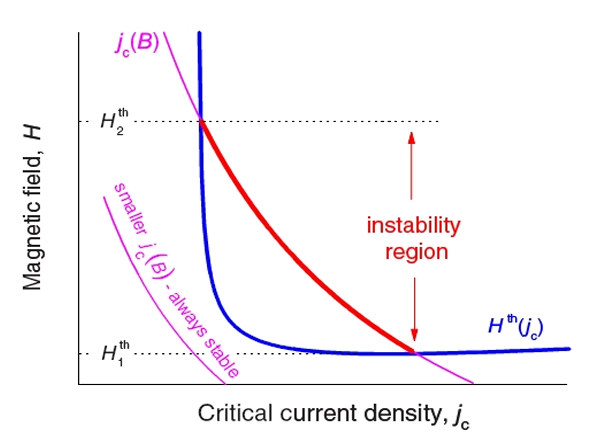
 Thermomagnetic instabilities in superconductors. When the applied magnetic field H is increased, vortices are forced to move and dissipation occurs in their normal cores.
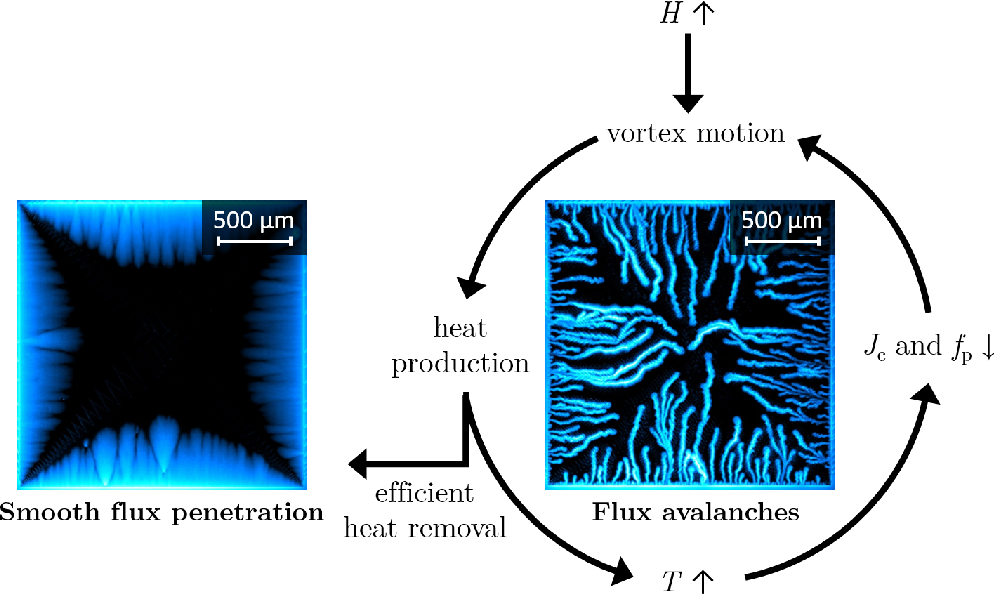
The critical state in these superconductors is not always stable and can collapse due to thermally driven flux jumps resulting in a sudden large-scale
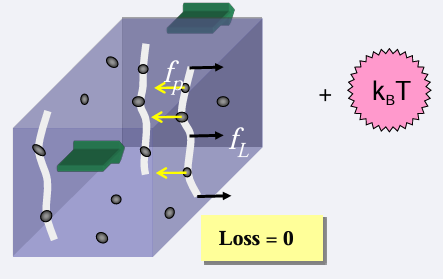
redistribution of vortices. These flux avalanches are due to thermomagnetic instabilities caused by local heat dissipation associated with vortex motion. This will reduce the pinning force and make it easier for more vortices to move into the sample. New vortex motion results in new heat dissipation, and we have positive feedback. The avalanches may vary in size from only a few hundred vortices to millions spanning the whole sample, depending on field strength and temperature.


Avalanches also appear when the magnetic field is decreasing, with a dependence on temperature and field as mentioned above. But these are triggered by negative or reversed flux lines just outside of the sample.
See Vortex Pathway
Magneto-optical Imaging (MOI)
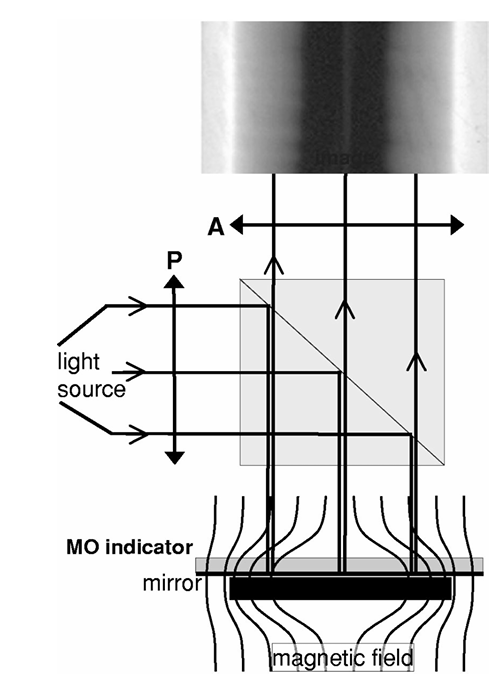 Principle of the magneto-optical imaging technique.
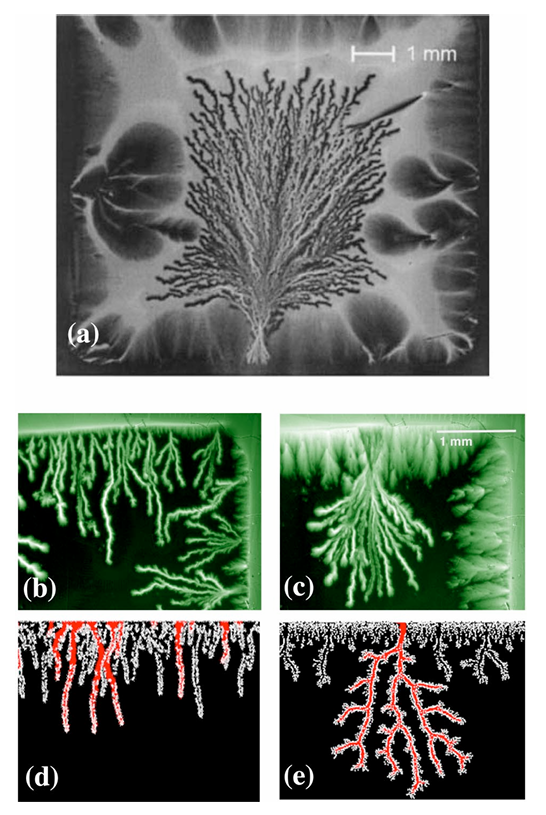 Flux dendrites formed
abruptly in thin-film superconductors
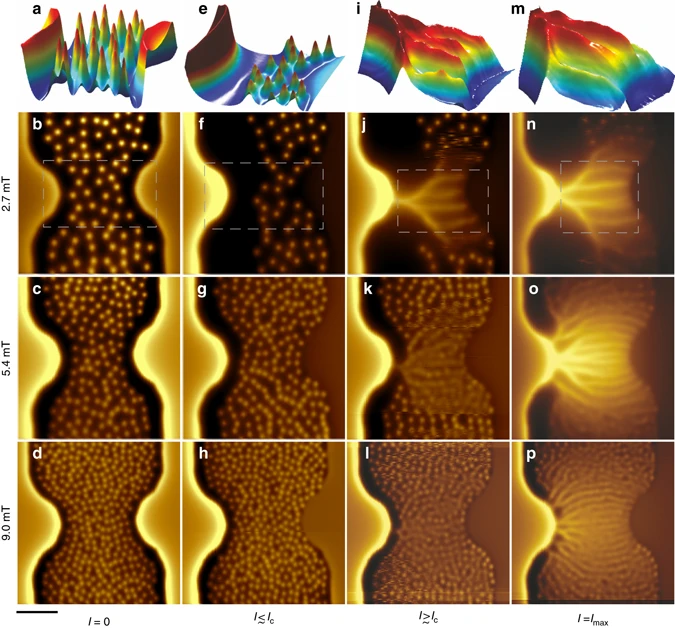
Vortex Avalanche Phenomenon
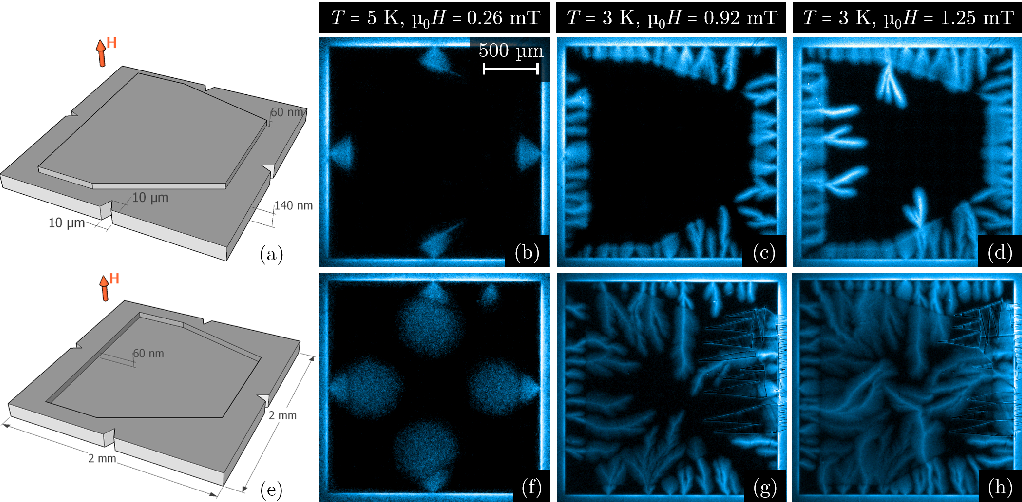 Flux penetration in a superconducting film with a step in thickness.
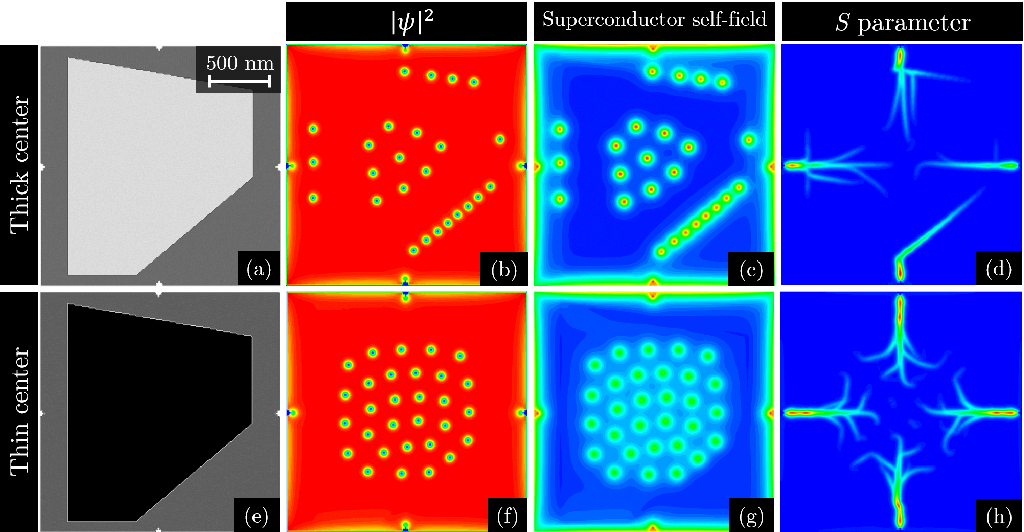 Time-dependent Ginzburg-Landau simulations on a superconducting film with a step in thickness.
 Magnetic imaging
 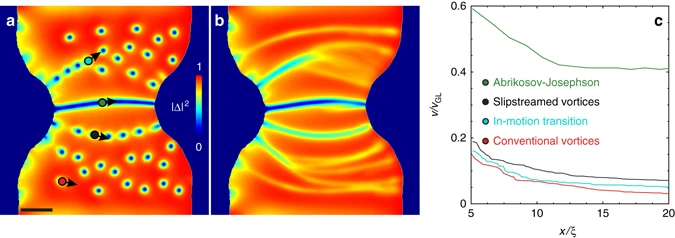 A snapshot a and time-averaged Cooper-pair density Δ 2(x, y) f stationary and fast-moving vortices in Pb film at 4.2 K
Artificial Avalanche Pathway
Charles Reichhardt https://cnls.lanl.gov/~charlesr/index.html
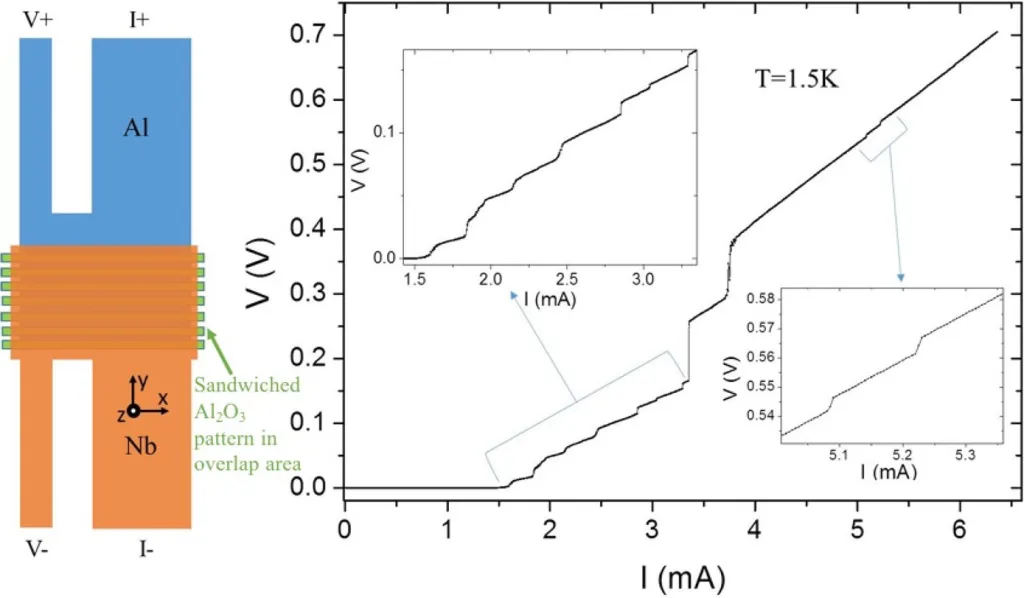 Figure 3. V versus I of a multiple horizontal channel sample as shown in the measurement scheme. The actual sample consisted of 15 horizontal lines of Al2O3 between the Al and Nb layers. The line separation and width is 2 μm. The number of voltage jumps (13) is close to the number of lithographically defined channels (see text).
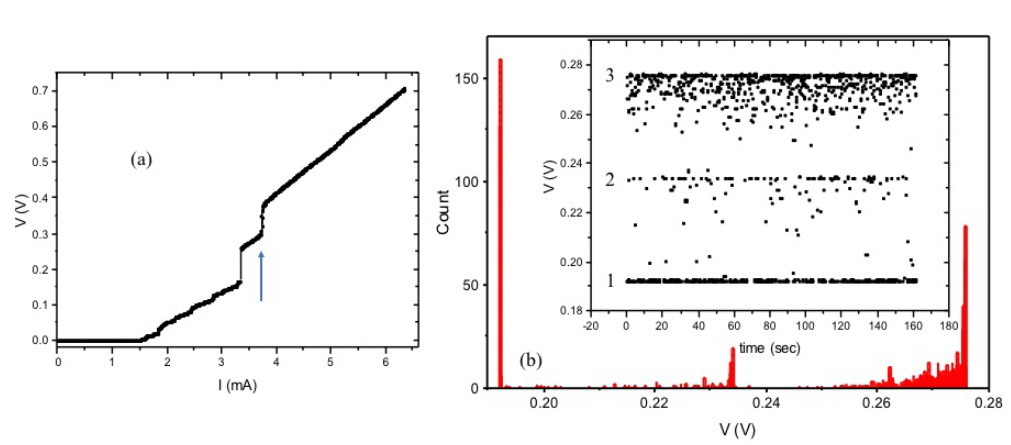 Figure S2 (color online): Channeling multistability observed at T=1.5K in the crossroad sample
as shown in fig. 3(a) of main text. (a) V vs I measurement showing 11 small voltage jumps and 2
big jumps (see also main text). Several voltage states are observed for a single current value of
3.69 mA, indicated with blue arrow. (b) Histogram of voltage values obtained for 3.69 mA
corresponding to the voltage time trace in the inset. The main voltage states (labeled 1, 2, 3)
correspond to the main peaks in the histogram and are evenly spaced.
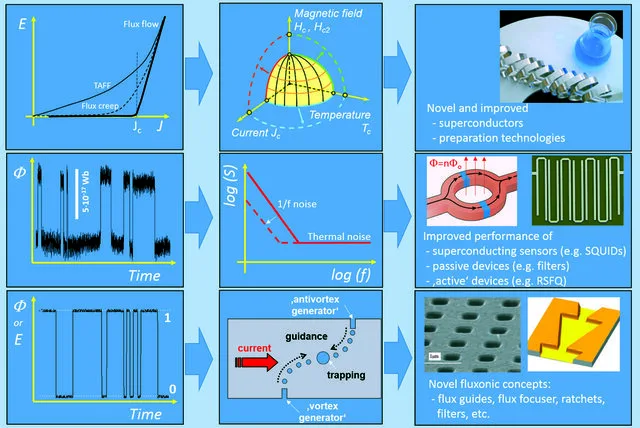 Schematic sketches of the different scenarios of the impact of vortex motion on technological superconducting and superconducting devices.
References
Charles Reichhardt’s Home Page (lanl.gov)
Tutorial_Vortices_em_Supercondutores.pdf (unicamp.br)
Imprinting superconducting vortex footsteps in a magnetic layer | Scientific Reports (nature.com)